[Youtube Video] Debugging a Samsung Smart TV Application: Breakpoints, Network, and Console
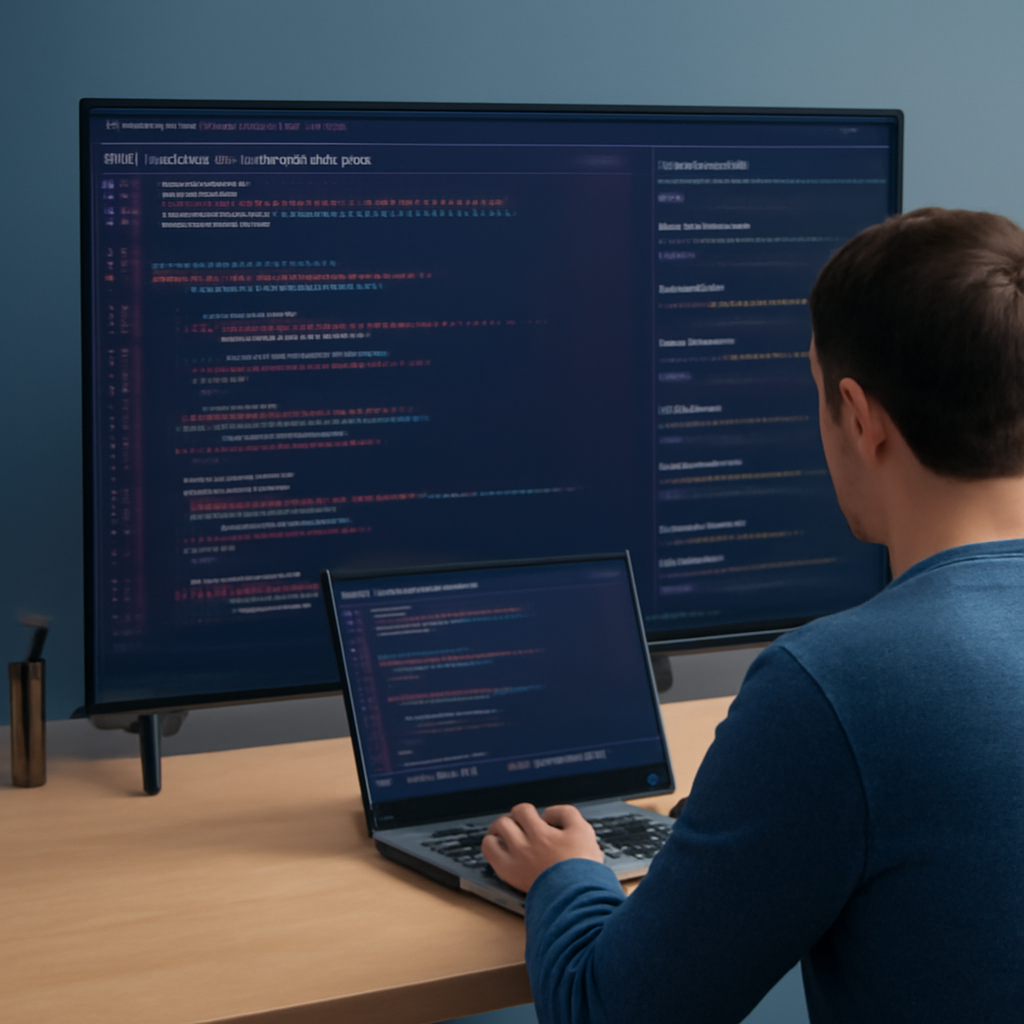
This second part of the Samsung Smart TV debugging series digs into the three most powerful sections of the Chrome-based debugger: Sources, Network, and Console. Together they give you deep visibility into your app’s logic, file loading, and runtime state.
The Sources Panel and Breakpoints
The Sources panel is the heart of the debugging workflow. On the left, a toggle panel lists every file loaded by your project — including the default widget.js (the application lifecycle manager), TVKeyValue.js (the remote key handler), and your own main.js. Clicking any file opens it in the editor pane with line numbers, ready for breakpoint placement.
To set a breakpoint, click the line number in the gutter — a blue marker appears to confirm it. Right-clicking the marker lets you remove it or add a condition. Once a breakpoint is active, refresh the app and code execution will pause at that line. You can then hover your mouse over any variable in scope to see a popup showing its current value. The Console provides a second inspection method: typing console.log(variableName) prints the value without hovering.
Stepping Through Code
When execution is paused at a breakpoint, the inspector panel on the right shows all break points and a Scope Viewer listing every in-scope variable. Click the Resume Script (play) button to continue execution to the next breakpoint. You can set as many breakpoints as you need, placing them wherever you suspect problems.
Conditional Breakpoints
When debugging a loop, stopping on every iteration is tedious. Conditional breakpoints solve this: right-click an existing breakpoint and choose Edit Breakpoint, then enter a JavaScript expression such as i === 5. The breakpoint will only fire when that expression evaluates to true, skipping every other iteration. Conditional breakpoints are shown in orange to distinguish them from unconditional ones, making it easy to see at a glance which breakpoints have conditions attached.
The Console as a Scratch Pad
The Console tab is more than a log viewer — it is a live JavaScript interpreter. While execution is paused, you can type expressions directly into the console to inspect or modify values. For example, calling localStorage.getItem('applicationStatus') returns the stored value immediately. You can also use localStorage.setItem() to change a value mid-session and observe how your app responds. Unlike the Elements panel, Console changes that write to localStorage persist across refreshes.
The Network Panel
The Network panel records every file the app requests — HTML, JavaScript, CSS, and any remote assets — along with the HTTP method used, the response status code, file type, initiator, file size, and load time. Refreshing the app while the panel is open populates the list. Clicking any file entry reveals the request headers, response headers, and a preview of the file content.
If your app feels slow to start or hangs while loading, the Network panel is the right place to investigate. Look for files with unusually high load times and consider minifying them or splitting large bundles into smaller files to improve startup performance.
What Is Covered Next
The Timeline, Profiles, and Audits panels — which focus on JavaScript performance profiling and rendering analysis — are reserved for part three of this series. Watch the full video to see every technique from breakpoints to network analysis demonstrated live inside the Samsung Smart TV SDK debugger.